Carbon Technostructure: Neural Fog
Collaboration with: Gijs de Heij
Support from: Ohme, fédération Wallonie Bruxelles
An AI hallucinates its own carbon footprint in vanishing steam.
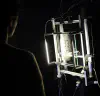
Carbon Technostructure traces the material weight of immaterial systems. A modified plotter, glass panel, and steamer work in concert to render visible what typically remains unseen: the environmental cost of computational processes.
Steam condenses on glass, creating an ephemeral drawing surface. An empty marker moves across this temporary canvas, inscribing patterns derived from real-time energy data. These marks exist only as disruptions in condensation, fading as quickly as our attention to digital infrastructure’s environmental impact.
For this iteration, we run a GPU hosting an open-source language model. We prompt it to hallucinate representations of its own energy consumption—a recursive gesture that produces both poetic output and measurable load. The installation monitors this consumption, cross-referencing it with the carbon intensity of the local electrical grid and subsequently plots it.
Each vanishing drawing offers a glimpse of the carbon technostructure we’ve built, one calculation at a time.
SOFTWARE
A Python script coordinates the full system. When a drawing cycle begins, the GPU runs a local open-source language model (LLM), prompted to generate an SVG representation of its own energy consumption — output the model cannot produce accurately, resulting in speculative, hallucinatory visuals. Simultaneously, a power monitor records the actual energy drawn by the GPU during inference (in kWh). A second process geolocates the installation and queries the Electricity Maps API — an external service — to retrieve the live carbon intensity of the local electricity grid (in gCO2/kWh). This figure is multiplied by the measured energy consumption to calculate the actual CO2 emitted during that inference, and passed back to shape the drawing. The LLM’s SVG output is then processed by vpype (path optimisation) and svg2gcode (conversion to plotter instructions), and sent to the Raspberry Pi, which drives the plotter. The AI inference and drawing pipeline run locally; the carbon intensity data is fetched in real time from an external API.
HARDWARE
The installation runs on self-contained hardware. A Raspberry Pi acts as the central controller: it orchestrates the system, triggers the steamer, and sends drawing instructions to the XY plotter. A dedicated GPU runs the open-source language model locally, generating the visual output during inference. A custom-built XY robotic plotter, fitted with an empty marker, draws directly onto a thick glass panel. A steamer continuously deposits condensation on the glass, creating the ephemeral drawing surface. The marks fade as the glass dries, leaving no permanent trace.
USE OF AI
An open-source large language model runs locally on a GPU integrated into the installation. The model is prompted to generate SVG representations of its own energy consumption: something it cannot truly know, producing speculative, hallucinatory output. This output is processed into drawing instructions and plotted in real time. The AI’s role is both functional (generating a visual) and conceptual: the act of running inference creates the very load being measured and visualised, forming a self-referential loop between computation and its environmental cost.
https://gitlab.constantvzw.org/gijs/carbon-aware
Avec le soutien de la Fédération Wallonie-Bruxelles
![]()